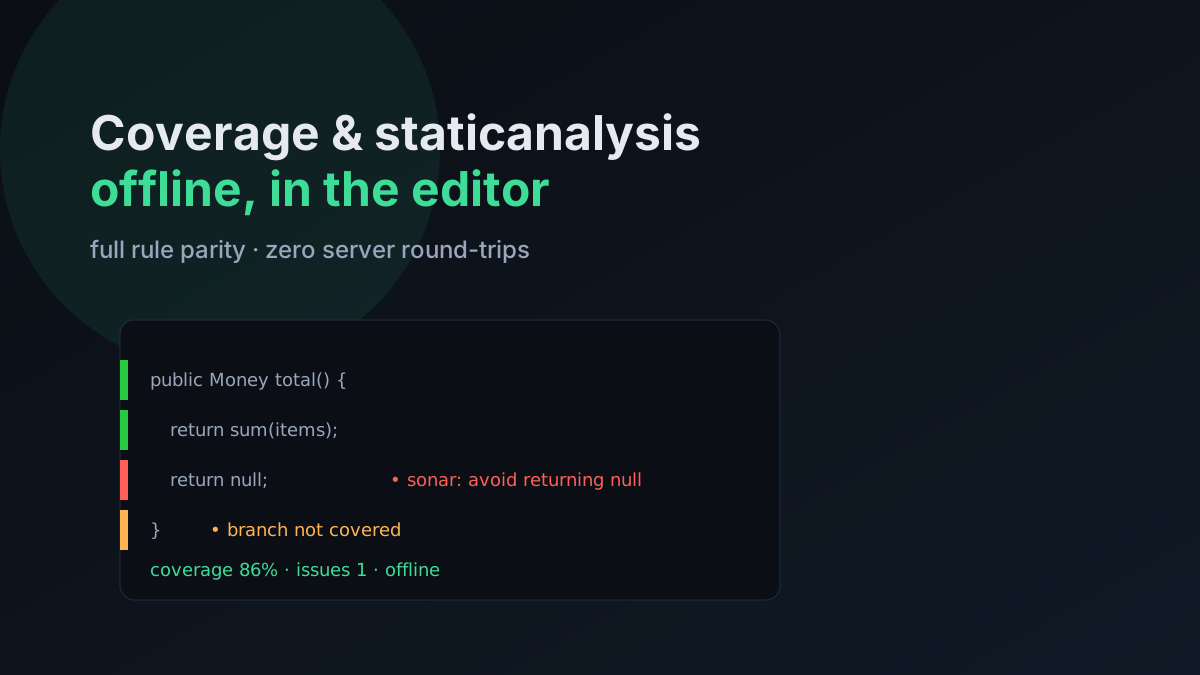
The feedback loop on code quality is usually too slow: you push, CI runs, and minutes later a quality gate tells you about a rule you broke. I wanted that feedback while I was still typing the line that caused it — and without sending code to any server. That’s the idea behind Code Insights: coverage and static analysis, live, in the editor, fully offline. Here’s how I reasoned about the design.
The core bet: run the real rules locally
The easy version of this tool calls a server to analyze your code. I deliberately didn’t want that — partly for speed, partly because sending source to an external service is exactly the kind of thing I try to avoid building.
So the central decision was to embed a real static-analysis engine in the extension and run it on-device, with full rule parity to what a server scan would report. No per-scan network calls. The trade-off is packaging complexity (you have to ship and drive a real analysis engine), but you get instant, private, offline results — which was the whole point.
If “offline” and “full parity” both matter, you have to own the engine, not call one. That’s a real cost; decide early whether the payoff justifies it. For a tool you live in all day, it did.
The architecture (HLD)
The shape that makes “offline + parity” work is three runtimes cooperating: the extension host (TypeScript) orchestrates everything but does no analysis itself; the actual work is done by spawned processes — mvn/gradle for tests and a JVM running the real sonar-java analyzer for rules. The only time anything touches the network is a one-time sync of the rule set; after that it’s fully local.
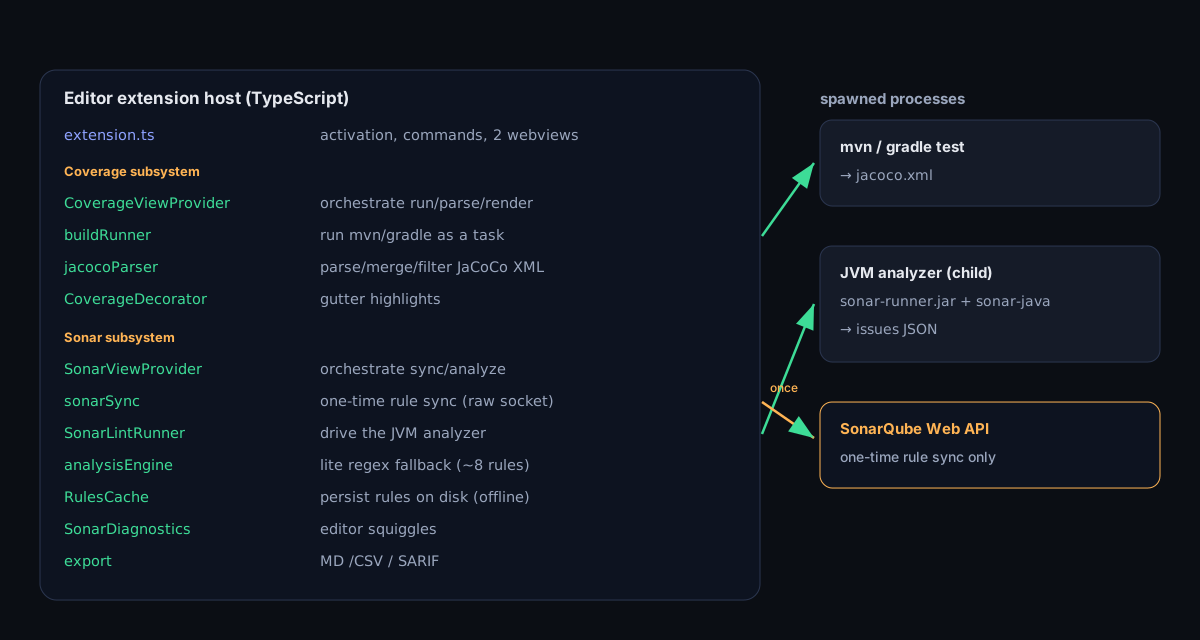
| Component | Responsibility |
|---|---|
extension.ts |
Activation; registers the two webview panels and all commands. |
CoverageViewProvider |
Orchestrates test runs, report parse/merge/exclude, render, navigation, export. |
buildRunner |
Runs mvn/gradle as an editor task. |
jacocoParser |
Parses JaCoCo XML, merges multi-module reports, filters. |
CoverageDecorator |
Gutter highlights for covered / partial / uncovered lines. |
SonarViewProvider |
Orchestrates connection setup, rule sync, analysis, suppression, export. |
sonarSync |
Pulls the quality profile’s active rules via the Sonar Web API (one time). |
SonarLintRunner |
Spawns the bundled JVM analyzer (sonar-java) out-of-process. |
analysisEngine |
Lite regex fallback (~8 rules) when the JVM engine can’t run. |
RulesCache |
Persists synced rules on disk for offline use. |
SonarDiagnostics |
Publishes issues as editor squiggles. |
export |
Serializes issues (MD/CSV/SARIF) and coverage (MD/CSV). |
The three flows
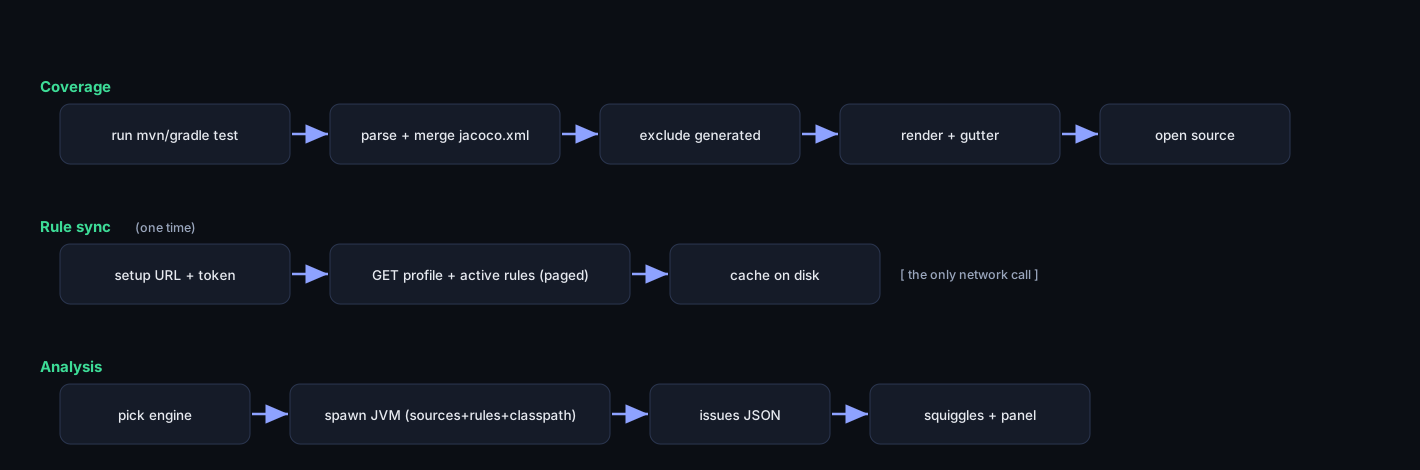
A couple of non-obvious decisions hold this together:
- Out-of-process JVM analyzer. Reimplementing Sonar rules in JavaScript would drift and be subtly wrong forever. Spawning the real
sonar-javagives rule parity for free, and the process boundary keeps an analyzer crash from taking the editor with it. - A lite regex fallback. If there’s no JDK/jars available, analysis degrades to a handful of regex rules rather than hard-failing — useful-but-degraded beats nothing.
- Sync once, cache on disk. After the initial rule pull, everything is offline; there are no per-keystroke (or even per-scan) server calls.
- A raw socket for the sync. The editor proxy-patches Node’s HTTP stack, which can mangle the one request that matters; connecting over a raw socket behaves like
curl/the browser and sidesteps it. - Exclude
target/and generated code. Coverage and issues should reflect your code, not MapStruct/OpenAPI/JAXB output — and the headline number uses Sonar’s own(covered lines + conditions) / (lines + conditions)formula so it matches the server.
Two signals, one panel: coverage + issues
The tool surfaces two things side by side:
- Coverage from JaCoCo — line and branch coverage rendered right in the gutter, so untested branches are obvious where you’d write the test.
- Static-analysis issues — the same findings a quality gate would flag, inline, with the rule that fired.
Putting them together answers the two questions you actually have about a change: is it correct-ish (covered)? and is it clean (no new issues)?
Meeting the build where it lives
A code-quality tool is useless if you have to hand-configure it per project. So it auto-detects Maven and Gradle, then resolves per-module classpaths (and dev / test / generated sources) so analysis sees what the compiler sees. On a multi-module project that classpath resolution is most of the hard work — get it wrong and you get a flood of false positives from unresolved symbols.
The general principle: a developer tool should adapt to the project, not the other way around. Every manual setup step is a reason someone won’t adopt it.
Performance: analyze less, cache more
Running real analysis on every keystroke would be unusable, so the design leans on two ideas:
- Combined analysis — do the work that coverage and rules share once, rather than walking the code twice. In practice this cut file reads roughly in half.
- Caching with a healthy hit rate — re-use results when inputs haven’t changed, so the common edit-rerun loop stays fast.
Neither is glamorous, but “is it fast enough to leave on?” is the question that decides whether a tool like this gets used or uninstalled.
Handle secrets like they matter
Where the tool needs a credential, it goes in the editor’s secret storage, never in plain settings files. It’s a small thing that’s easy to get wrong, and getting it wrong is the kind of mistake that ends up in a screenshot. Default to the secure store.
The takeaways
- Decide “offline + parity” up front — it’s an architectural commitment (own the engine), not a setting you toggle later.
- Show the signals that map to real questions — covered? clean? — together.
- Auto-detect the build; every manual step costs you adopters.
- Make it fast enough to always leave on via combined work + caching.
- Secrets go in the secret store, full stop.
The meta-lesson is the one I keep relearning across these tools: the best developer experience is the one that’s instant, private, and requires no setup — so those become design constraints, not afterthoughts.