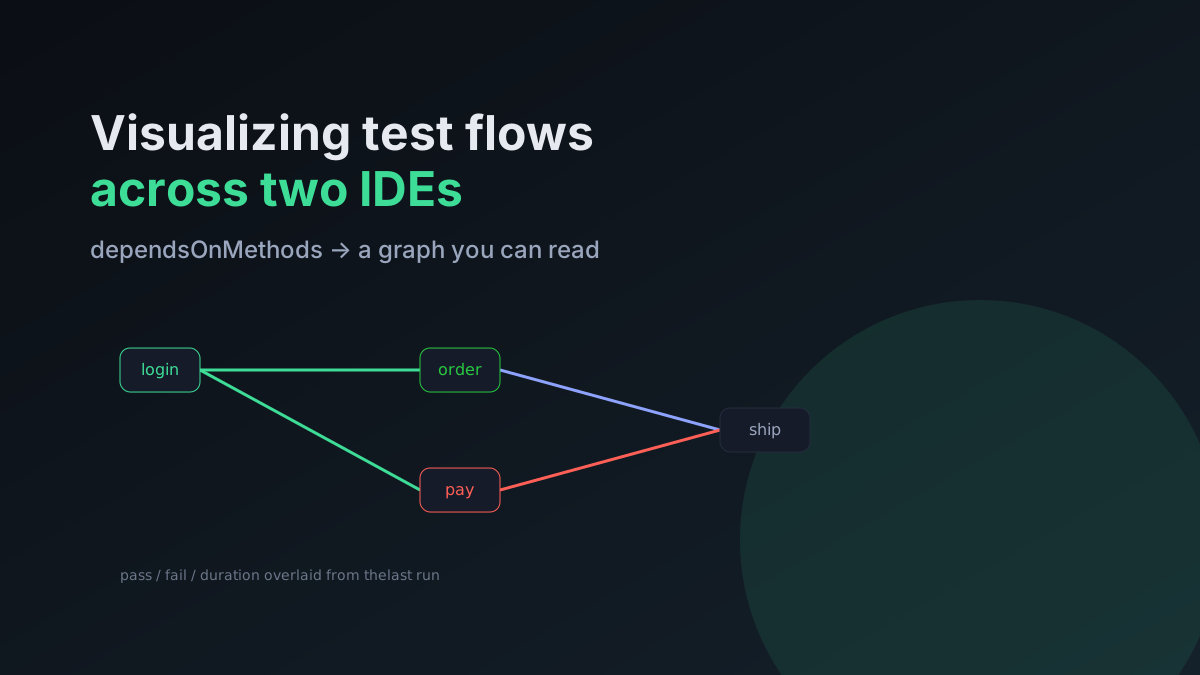
This one started as a brainstorm - “what tools would actually improve our developer experience?” - and the answer that kept coming back was the one people used every day: making sense of TestNG flows.
Big suites encode their execution order implicitly through dependsOnMethods, and reading that by hand is miserable.
So Auto Flow View draws it as a graph. Here’s the journey and the decisions that shaped it.
Decision 1: make it generic from day one
The brief I set myself was “as generic as possible.” That single constraint drove a lot:
- Parse Maven Surefire/Failsafe, Gradle (
build/test-results), and TestNG’s nativetestng-results.xml. Because the Surefire/Gradle XML is shared, the tool works for TestNG and JUnit for free. - Use framework-neutral names in the code (
TestOutcome,TestRunData), not TestNG-specific ones, so the model doesn’t paint itself into a corner. - Make report locations configurable (
autoflowview.testResults.reportGlobs) instead of hard-coding paths.
Generic-by-default cost almost nothing up front and meant the tool wasn’t tied to one team’s exact setup.
Decision 2: the same idea on two platforms
The flow graph was useful enough that it earned a second home: a VS Code extension and an IntelliJ plugin. They share the concept but not the implementation:
- VS Code does heuristic Java analysis to infer the dependency graph from annotations.
- IntelliJ uses the platform’s PSI for accurate, type-aware analysis.
The lesson: “port it to another IDE” isn’t a copy-paste job. The model (tests, edges, outcomes) ports cleanly; the analysis layer has to be rewritten against each platform’s reality. Keeping those two concerns separate is what made the second platform feasible.
Decision 3: the test-run overlay
A flow graph tells you “what runs before what.” The feature that made it click was layering the last run’s results onto the graph: each node colored by pass/fail, annotated with duration, a summary banner up top, failed cards outlined in red. “See the scenario” became “see the scenario and how it did.”
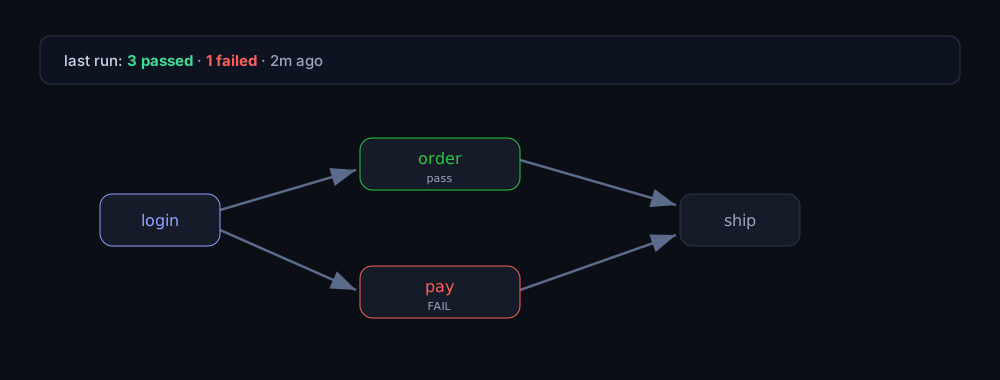
The design rule I held to: the overlay must never tax the normal path. So report scanning runs only on demand, never during regular flow analysis. It de-dupes files, caps how many it scans, skips oversized files, guards against overlapping scans, and aggregates parameterized rows and retries per class::method. Opt-in, bounded, and local-only (no network) — in line with keeping everything privacy-respecting.
Decision 4: heuristic analysis now, type-aware where it’s cheap
The hardest call was how to read the Java. Two honest options:
| Approach | Cost | Accuracy | Where it fits |
|---|---|---|---|
| Heuristic — scan source for annotations and method names, build the graph from text | Cheap; no JVM, no project index, instant | Good enough; can miss inheritance / cross-file edges | VS Code, where there’s no Java index to lean on |
| PSI — use the IDE’s resolved program model | “Free” in IntelliJ (the index already exists) | High; type-aware, resolves inheritance and references | IntelliJ, where the index is already there |
The reasoning: in VS Code, building a full Java semantic model just to draw a graph would be a huge dependency and a slow first-run. A heuristic pass over @Test(dependsOnMethods = …), @Test(groups = …), @BeforeMethod/@AfterMethod, and method names gets you a correct graph for the overwhelming majority of suites at near-zero cost. In IntelliJ the calculus flips — the PSI index already exists, so using it is both cheaper and more accurate. Same feature, opposite right answer, because the platform’s starting point is different.
“Which analysis technique?” is rarely absolute — it depends on what the host already gives you for free. Don’t pay for a semantic model the platform won’t reward you for.
Under the hood: the technical details
A few pieces that made it work:
The data model is the portable core. Everything reduces to a small, framework-neutral shape — tests as nodes, dependsOnMethods as directed edges, plus an optional outcome:
TestNode   { id: "class::method", group?, config? }
Edge       { from, to }            // from dependsOnMethods
TestRunData{ outcomes: Map<id, TestOutcome> }
TestOutcome{ status: pass|fail|skip, durationMs, failureMessage? }
Because the graph and the outcomes are separate, analysis can run without a single test result, and the overlay can attach later without touching the graph builder.
Reading results from whatever the build produced. The results layer parses three formats and normalizes them into TestOutcomes:
- Maven Surefire/Failsafe (
target/surefire-reports/*.xml) - Gradle (
build/test-results/**/*.xml) - TestNG native (
testng-results.xml)
Since Surefire/Gradle XML is the shared JUnit-style schema, the overlay supports JUnit and TestNG from the same code. Parsing aggregates parameterized rows and retries per class::method (so 20 data-driven invocations show as one node with a roll-up), skips config methods (@BeforeMethod and friends aren’t “tests”), and decodes failure messages for the tooltip.
The performance rules are explicit, not incidental. Report scanning is the only expensive thing, so it’s fenced off: it runs on demand only (never during normal flow analysis), de-dupes report files, caps how many it reads, skips oversized files, and uses an overlapping-scan guard so a second trigger can’t pile work on the first. All reads are local — no network, ever.
Rendering is a webview that draws the graph, with a search popover to filter nodes and a summary banner for the run. (More on that popover in a second — it’s where a bug was hiding.)
What I’m taking away
- “Generic” is a cheap constraint to adopt early and an expensive one to retrofit. Neutral names + configurable inputs paid for themselves immediately.
- Separate the portable model from the platform-specific analysis — that boundary is what made a second IDE realistic.
- Opt-in, bounded work keeps a “nice to have” overlay from degrading the core experience.
- Quarantine in-flight work so you can ship without entangling your change in someone else’s unfinished refactor.
- Let the platform pick the technique — heuristic where there’s no index, type-aware where one already exists. The “right” approach is relative to the host.
The thread tying it together: respect the codebase you’re actually in, not the clean one you wish you had.