This is the implementation-level companion to the Auto Flow View overview.
The design story — and why VS Code and IntelliJ make opposite analysis choices — is in Visualizing TestNG flows across two IDEs.
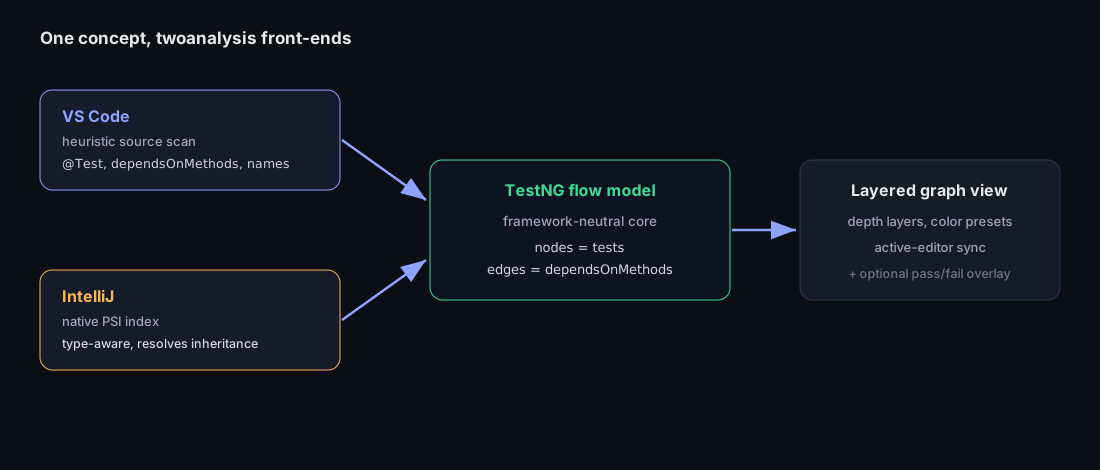
The portable core
Everything reduces to a small, framework-neutral data model, which is what lets the same concept ship on two IDE platforms:
TestNode   { id: "class::method", group?, config?, declaringClass, line, params? }
Edge       { from, to }            // from dependsOnMethods
TestRunData{ outcomes: Map<id, TestOutcome> }
TestOutcome{ status: pass | fail | skip, durationMs, failureMessage? }
Because the graph and the outcomes are separate data, analysis can run without a single test result, and the run overlay can attach later without touching the graph builder.
The parser (VS Code: heuristic)
In VS Code there’s no Java index to lean on, so the parser is line-oriented and regex-based.
It scans each .java source for:
- method-level
@Testannotations (and thedescriptionwhen present), dependsOnMethodsin both single and array form,@Parameterskeys declared above a@Test,@BeforeMethod/@AfterMethod/config annotations,- the
void methodName(declaration to anchor a node to its source line.
A heuristic pass gets a correct graph for the overwhelming majority of suites at near-zero cost. The known trade-off: odd formatting, generated code, or @Test-like text inside strings or comments can mislead the scanner — rare in normal flows, and the price of not shipping a full Java semantic model just to draw a graph.
Superclass merging
Flow suites put shared steps (token creation, setup) in base classes, so the parser resolves inheritance from text: package + import + extends give a fully-qualified name, which it turns into a **/ClassName.java workspace search. It loads the parent source, merges its @Test methods into the graph, and applies override rules (a subclass method of the same name wins). Each card shows the declaring class so you can tell a base step from a leaf one. A dependsOnMethods target that isn’t found in the merged sources still gets a stub node, so the chain stays visible.
The layered graph algorithm
Nodes + edges become a layout in two steps:
- Topological order over the
dependsOnMethodsedges. - Layer indices by dependency depth — a node sits one layer below the deepest thing it depends on. Each layer renders as a row, with arrows down to the next.
Two safety checks ride along:
- Parallel-layer warning. If two or more methods share a layer with no dependency edge between them, an amber banner flags it — they may run in any order, so you can decide whether a stricter
dependsOnMethodsis warranted. - Cycle detection. If
dependsOnMethodsforms a cycle, a warning is shown and ordering is reported as partial rather than looping.
What the panel renders
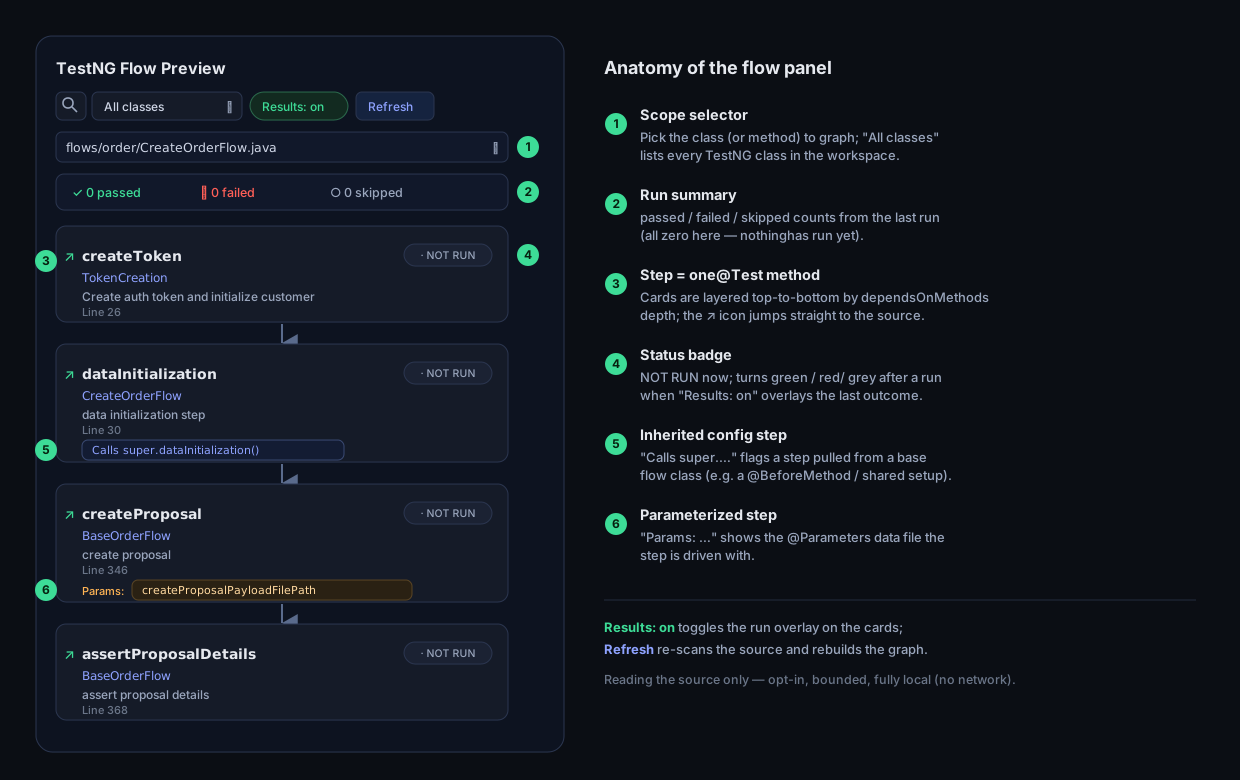
The graph renders as a scrollable column of step cards. Each card carries the method name (with a jump-to-source link), its declaring class, the @Test description, the source line, a status badge, and tags: Calls super.… for an inherited config step and Params: … for a parameterized one. Clicking a card opens the right .java file, selects the declaration line, and briefly highlights it.
The test-run overlay (framework-agnostic)
The overlay layers the last run’s results onto the cards: each badge colored pass/fail/skip, durations annotated, failed cards outlined, and a summary banner up top. It reads local test reports only — Maven Surefire/Failsafe, Gradle build/test-results, and TestNG testng-results.xml. Because the Surefire/Gradle XML is shared, the overlay works for both TestNG and JUnit suites.
The design rule was that the overlay must never tax the normal path, so report scanning:
- runs only on demand (a toolbar toggle / command), never during normal flow analysis,
- de-dupes files and caps how many it scans,
- skips oversized files and guards against overlapping scans,
- aggregates parameterized rows and retries per
class::method.
Everything is opt-in, bounded, and local-only — no network.
Commands and settings
autoflowview.openFlowDiagram                 # file/folder picker -> one or many flows
autoflowview.openFlowDiagramFromActiveFile   # analyze the active editor's file
Auto Flow View: Overlay Last Test Run        # scan local reports, overlay results
Auto Flow View: Clear Test Run Overlay
autoflowview.syncPreviewWithActiveEditor default false # reload on tab change/save (debounced ~450ms)
autoflowview.testResults.reportGlobs Maven/Gradle/TestNG defaultsAuto-sync is off by default so the preview doesn’t re-parse on every tab switch; turn it on only when you want live updates.
The IntelliJ port: same idea, opposite right answer
The sibling IntelliJ plugin builds the same flow model, but reads the Java through the platform’s PSI index instead of heuristics. The index already exists in IntelliJ, so type-aware analysis that resolves inheritance and references is both cheaper and more accurate there. In VS Code, building that semantic model from scratch just to draw a graph would be a huge dependency and a slow first run — so the heuristic pass is the right call. Same feature, opposite decision, because each platform’s starting point is different.
Performance and limits
- Parsing is lightweight (line/regex), suitable for typical scenario files.
- Inheritance uses workspace-wide file search per superclass, so very deep chains or huge monorepos add delay — prefer scoped (single file / small folder) selection.
- Heuristic parsing is not a full AST; unusual method signatures may not link cleanly, and classes outside the workspace appear as stubs.
- The parallel banner means “no dependency edge in our graph” — not a guarantee about TestNG’s runtime thread behavior.